For all the effort, ingenuity, and resources shippers put into cutting costs and streamlining operations, there are always savings opportunities found in logistics statistics hidden somewhere in the supply chain. The key (and the challenge) is knowing where to look.
And where, exactly, is that? That largely depends on what, where and when you ship, but there are some clues out there that can help you take the first step in the right direction.
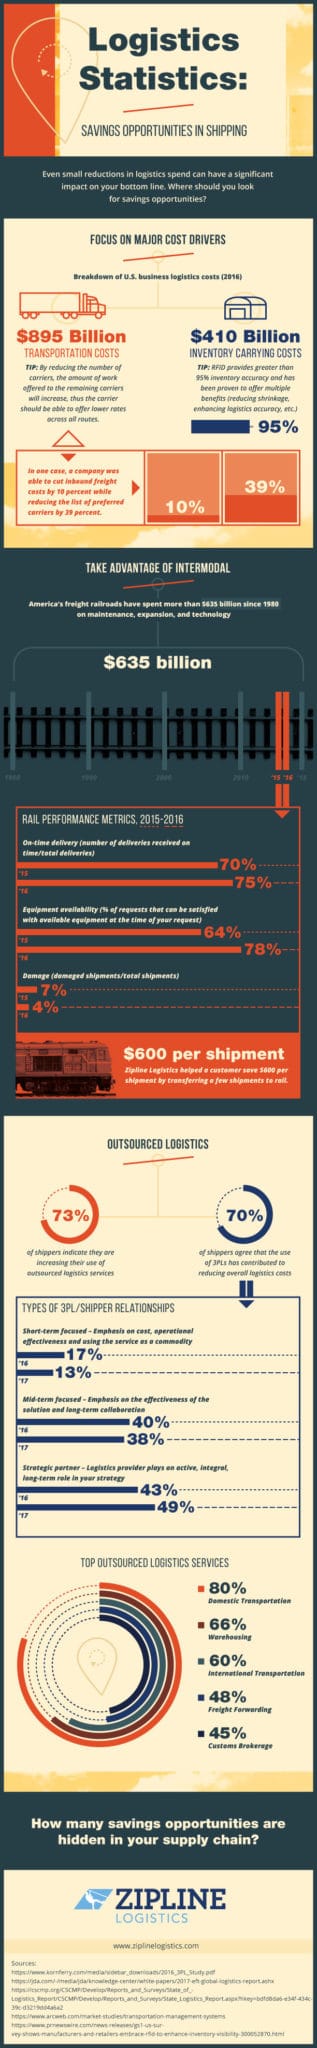
Logistics Statistics
In this infographic, we pulled together some key logistics statistics that may help you discover savings opportunities hidden in your own supply chain. For example, between 2015 and 2016, the on-time delivery rate for rail increased from 70% to 75%. If you had reservations in the past about taking advantage of intermodal, this stat may convince you to reconsider.

Share this Image On Your Site
We hope this infographic sparks ideas about ways your business can cut shipping costs. For even more savings opportunities check out our new free guide, Logistics Spend Management. This guide is designed for business owners and supply chain decision makers who want to achieve optimum logistics performance. It’s full of tips and actionable insights that can help you reduce total logistics costs.

The post Logistics Statistics: Savings Opportunities in Shipping (INFOGRAPHIC) appeared first on Zipline Logistics.